In the earlier posts, we have introduced the idea of Safe Withdrawal Rate and the 4% rule, while also saying that 4% is merely a rule of thumb and it can lead to portfolio failures - meaning you have no capital left during your lifetime.
Today, let´s have some fun with a website specialized in running MonteCarlo simulations on different portfolios with different hypothesis behind. The idea is to run several thousands of portfolios keeping certain factors constant (initial capital, your desired cash flow) while changing others (e.g. yearly returns, inflation).
If at the end of the desired lifetime (e.g. 40 years), you still have 1 Euro left in the bank account, then your portfolio survived. If the portfolio reaches 0 Euro before, it just didnt. Run the simulation for 10000 different scenarios and you start to have a feel for how risky your strategy is.
The website I am using for this is https://www.portfoliovisualizer.com/monte-carlo-simulation. Shout out to them for making this available to everyone!
Let´s go back to the original model we discussed together and retrieve the numbers:
- Desired Cash flows (Monthly): 2,650 Euro
- Expected Returns: 6%
- Expected inflation: 1.85%
- Capital Required: 766,265 Euro
The tool has a very simple interface that allows everyone to input the key numbers easily. Below you can see what I did:
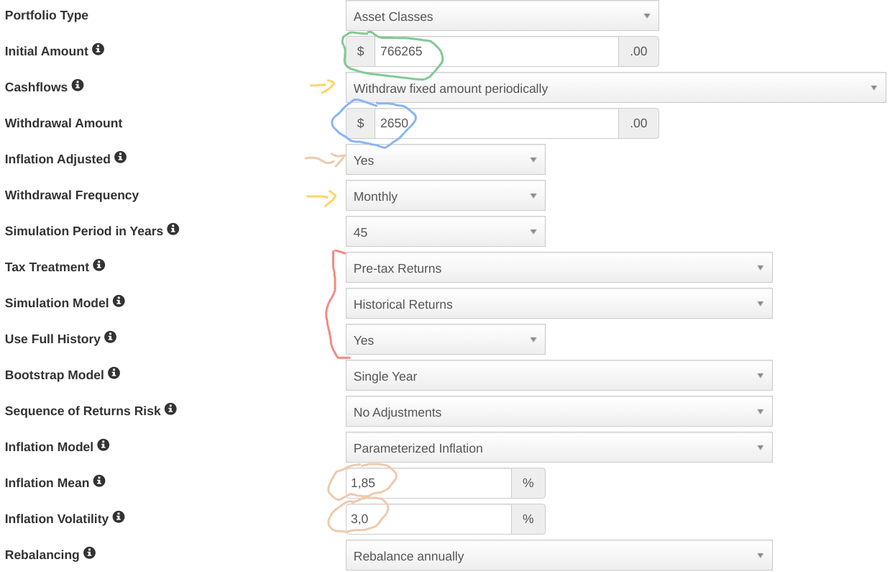
The initial amount (circled in green) is equal to the Capital I set aside when reaching my goal and the 2,650 Euro (circled in blue) are listed as Monthly withdraws (yellow arrows) and are inflation adjusted (brown arrow) with a mean of 1,85% and a volatility of 3.0% (both circled in brown). I believe the volatility refers to the standard deviation of the inflation - based on my historical series it should be 1.2%, but I decided to leave the 3.0% the model gives as default to make the simulation a bit more challenging on that aspect.
In terms of lifetime, I set it at 45 years - if I retire at 50, I want the portfolio to survive until 95 years old.
In the red quare parenthesis, we indicate we want to see the pre-tax returns (to keep things simple) and use the historical returns with full history (therefore here I am deviating from my assumptions to use historical data).
Finally, you need to indicate your asset allocation:
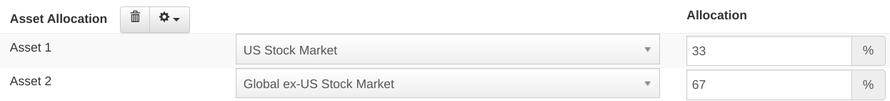
In line with what I have been doing until now, I have 100% Equity and a geographical split of 33% USA (North America to be more precise) and 67% rest of world.
Then, you are ready can click on "Run Simulation" button. You will get something like this, which we can interpret together:
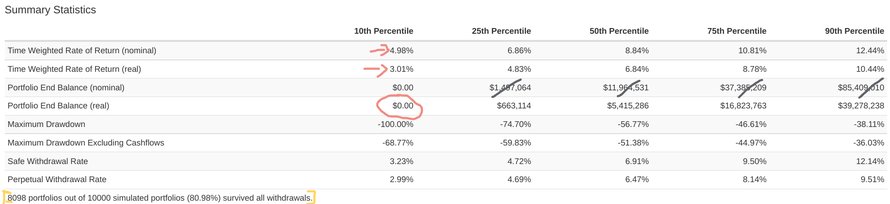
The results are split in Percentiles - the 10th Percentile includes the data of the 10% bottom outcomes, the 25th Percentile includes the 25% bottom outcomes and so on and so forth.
You can see that in the bottom 10% of the cases, we averaged a (yearly) Nominal rate of returns of 4.98% and a Real return of 3.01% (red arrows). This means the inflation was on average 1.97%. With the other hypothesis we set in the simulation, our portfolio did NOT survive the full 45 years. You can see this because the Portfolio End Balance is zero (red circle).
You can see at the bottom (within the yellow parenthesises) that "only" 80.98% of our portfolio survived the simulation, meaning that 19.02% did not.
Looking at the median (50% Percentile), we would have ended up with a (real) capital of app. 5.4 mln Euro. This is thanks to a yearly average Real return of 6.84%. You can ignore the Nominal Portfolio End Balance (crossed in black) because that is meaningless as it does not consider inflation and the loss of purchase power across time.
Another very interesting outcome is detailed in the graph below:
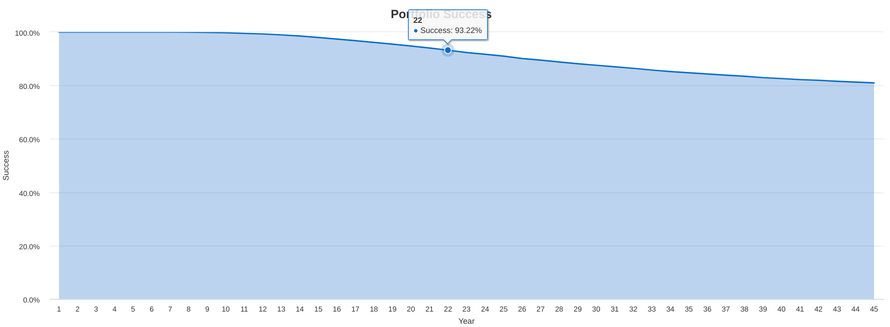
Here you can see when your portfolio starts to fail - so to speak. In the first 7 years, the success rate is 100% - but already at the 8th year the curve starts to drop - meaning there are a few scenarios where the portfolio fails and goes to zero residual value.
After 22 years, the success probability is 93.22% and at the end of the time frame (45 years) we reach the 80.98% we encountered earlier.
The key insight here is that there can be (extreme) cases of a portfolio failing even very early on!
To conclude, when confronted with thousands simulations based on past data, our first model would have succedeed in providing us cash flows for 45 years in around 80% of the cases. First failures could occurr already before 10 years. I am not making here any qualitative judgement: whether this is acceptable or not, it depends on your risk profile.
This is just the first test we will do using this tool, next time we will start to play around - hope you enjoyed and stay tuned for more!
Write a comment